Agency Trading Commissions Paid by Funds and ETF Managers Top $3.9 Billion; Up almost $500 million from the previous year
Published 9/9/2025 · by Clarivant Data
BrokerShare by Clarivant Data provides full visibility into agency trading commissions, broker market share, and peer benchmarks.
Our latest report highlights how nearly $4B in commissions were allocated across 847 investment managers and 570 brokers—revealing where market share is concentrated and where opportunities lie.
Key Takeaways
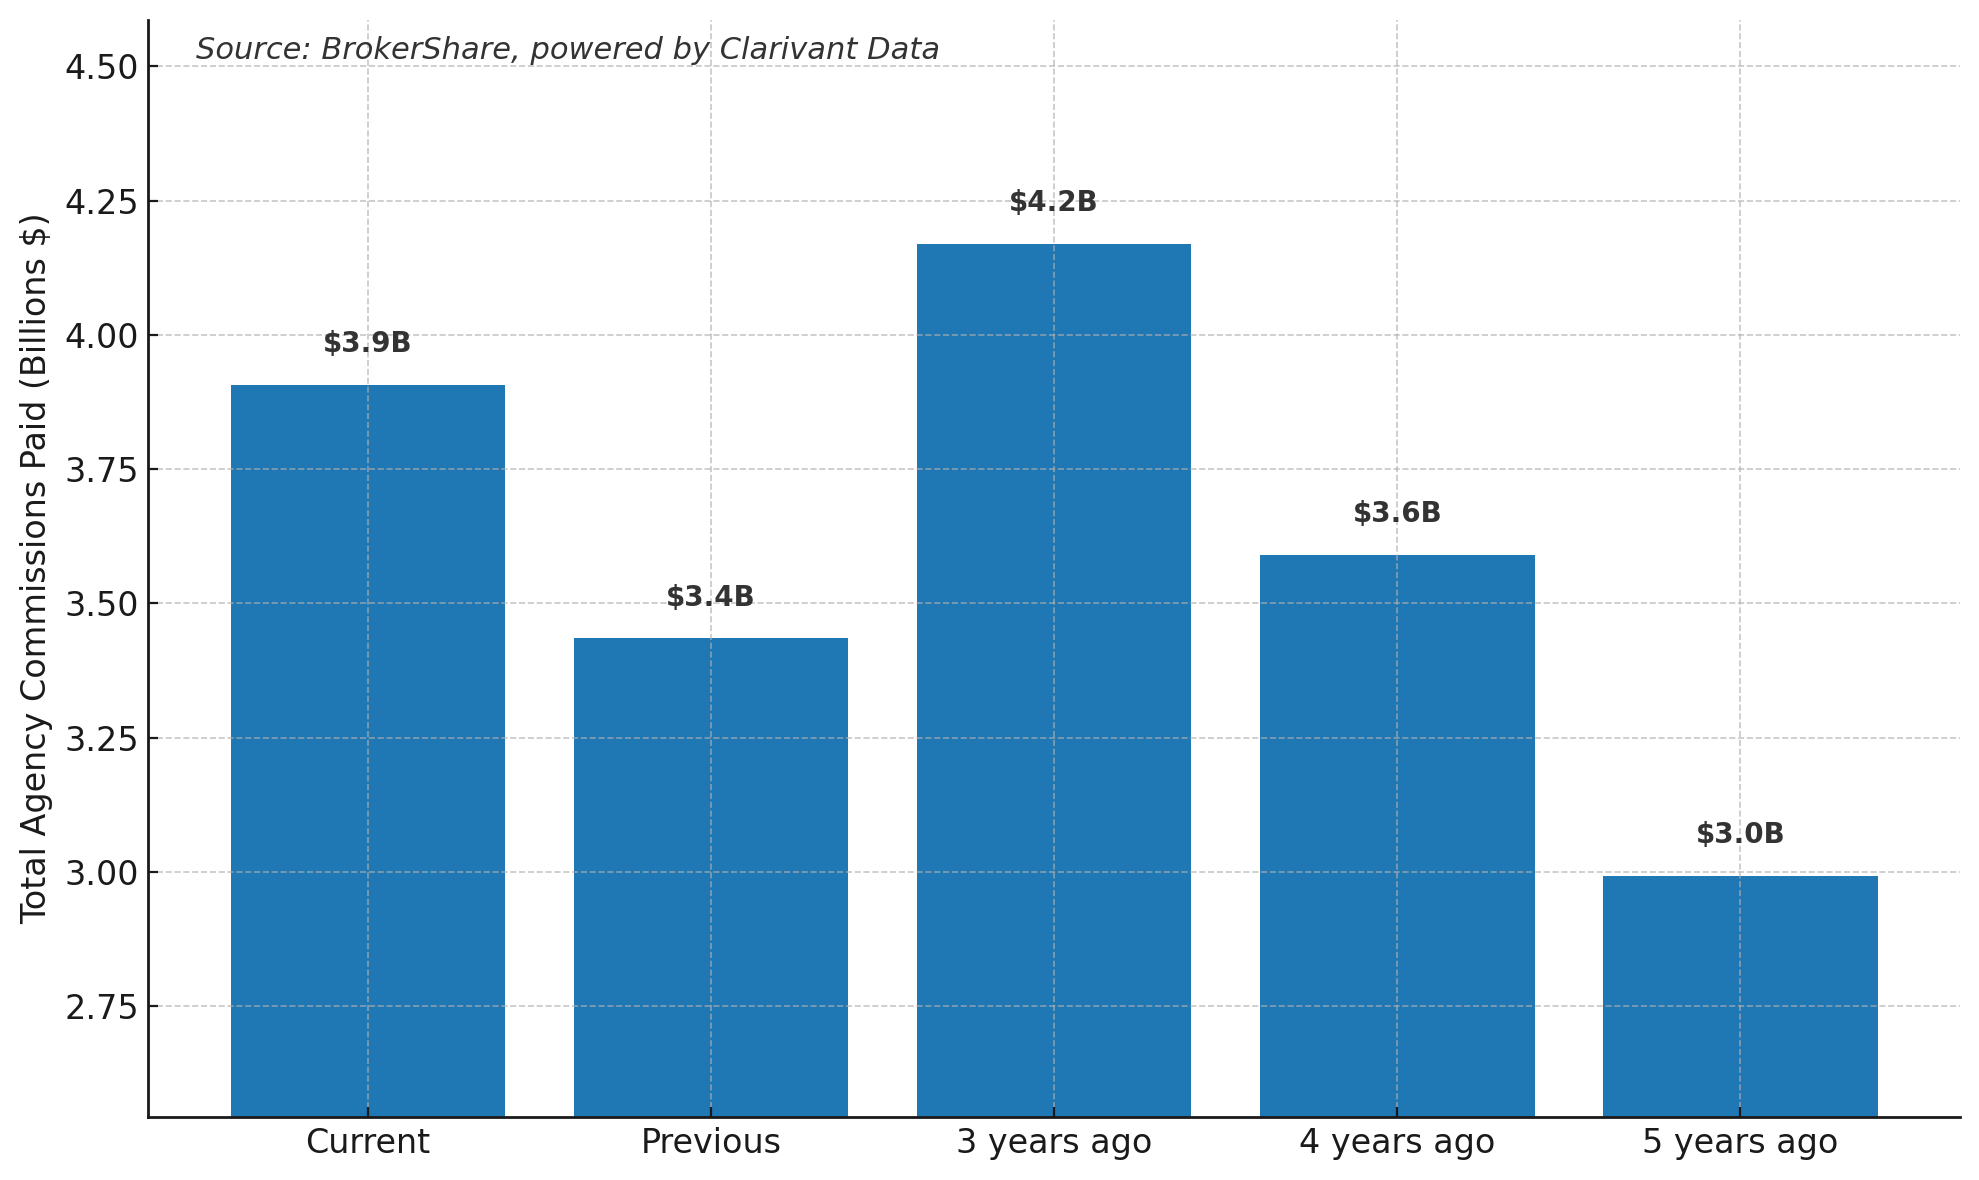
Total commissions reached $3.9B, up $471M (+13.7%) YoY.
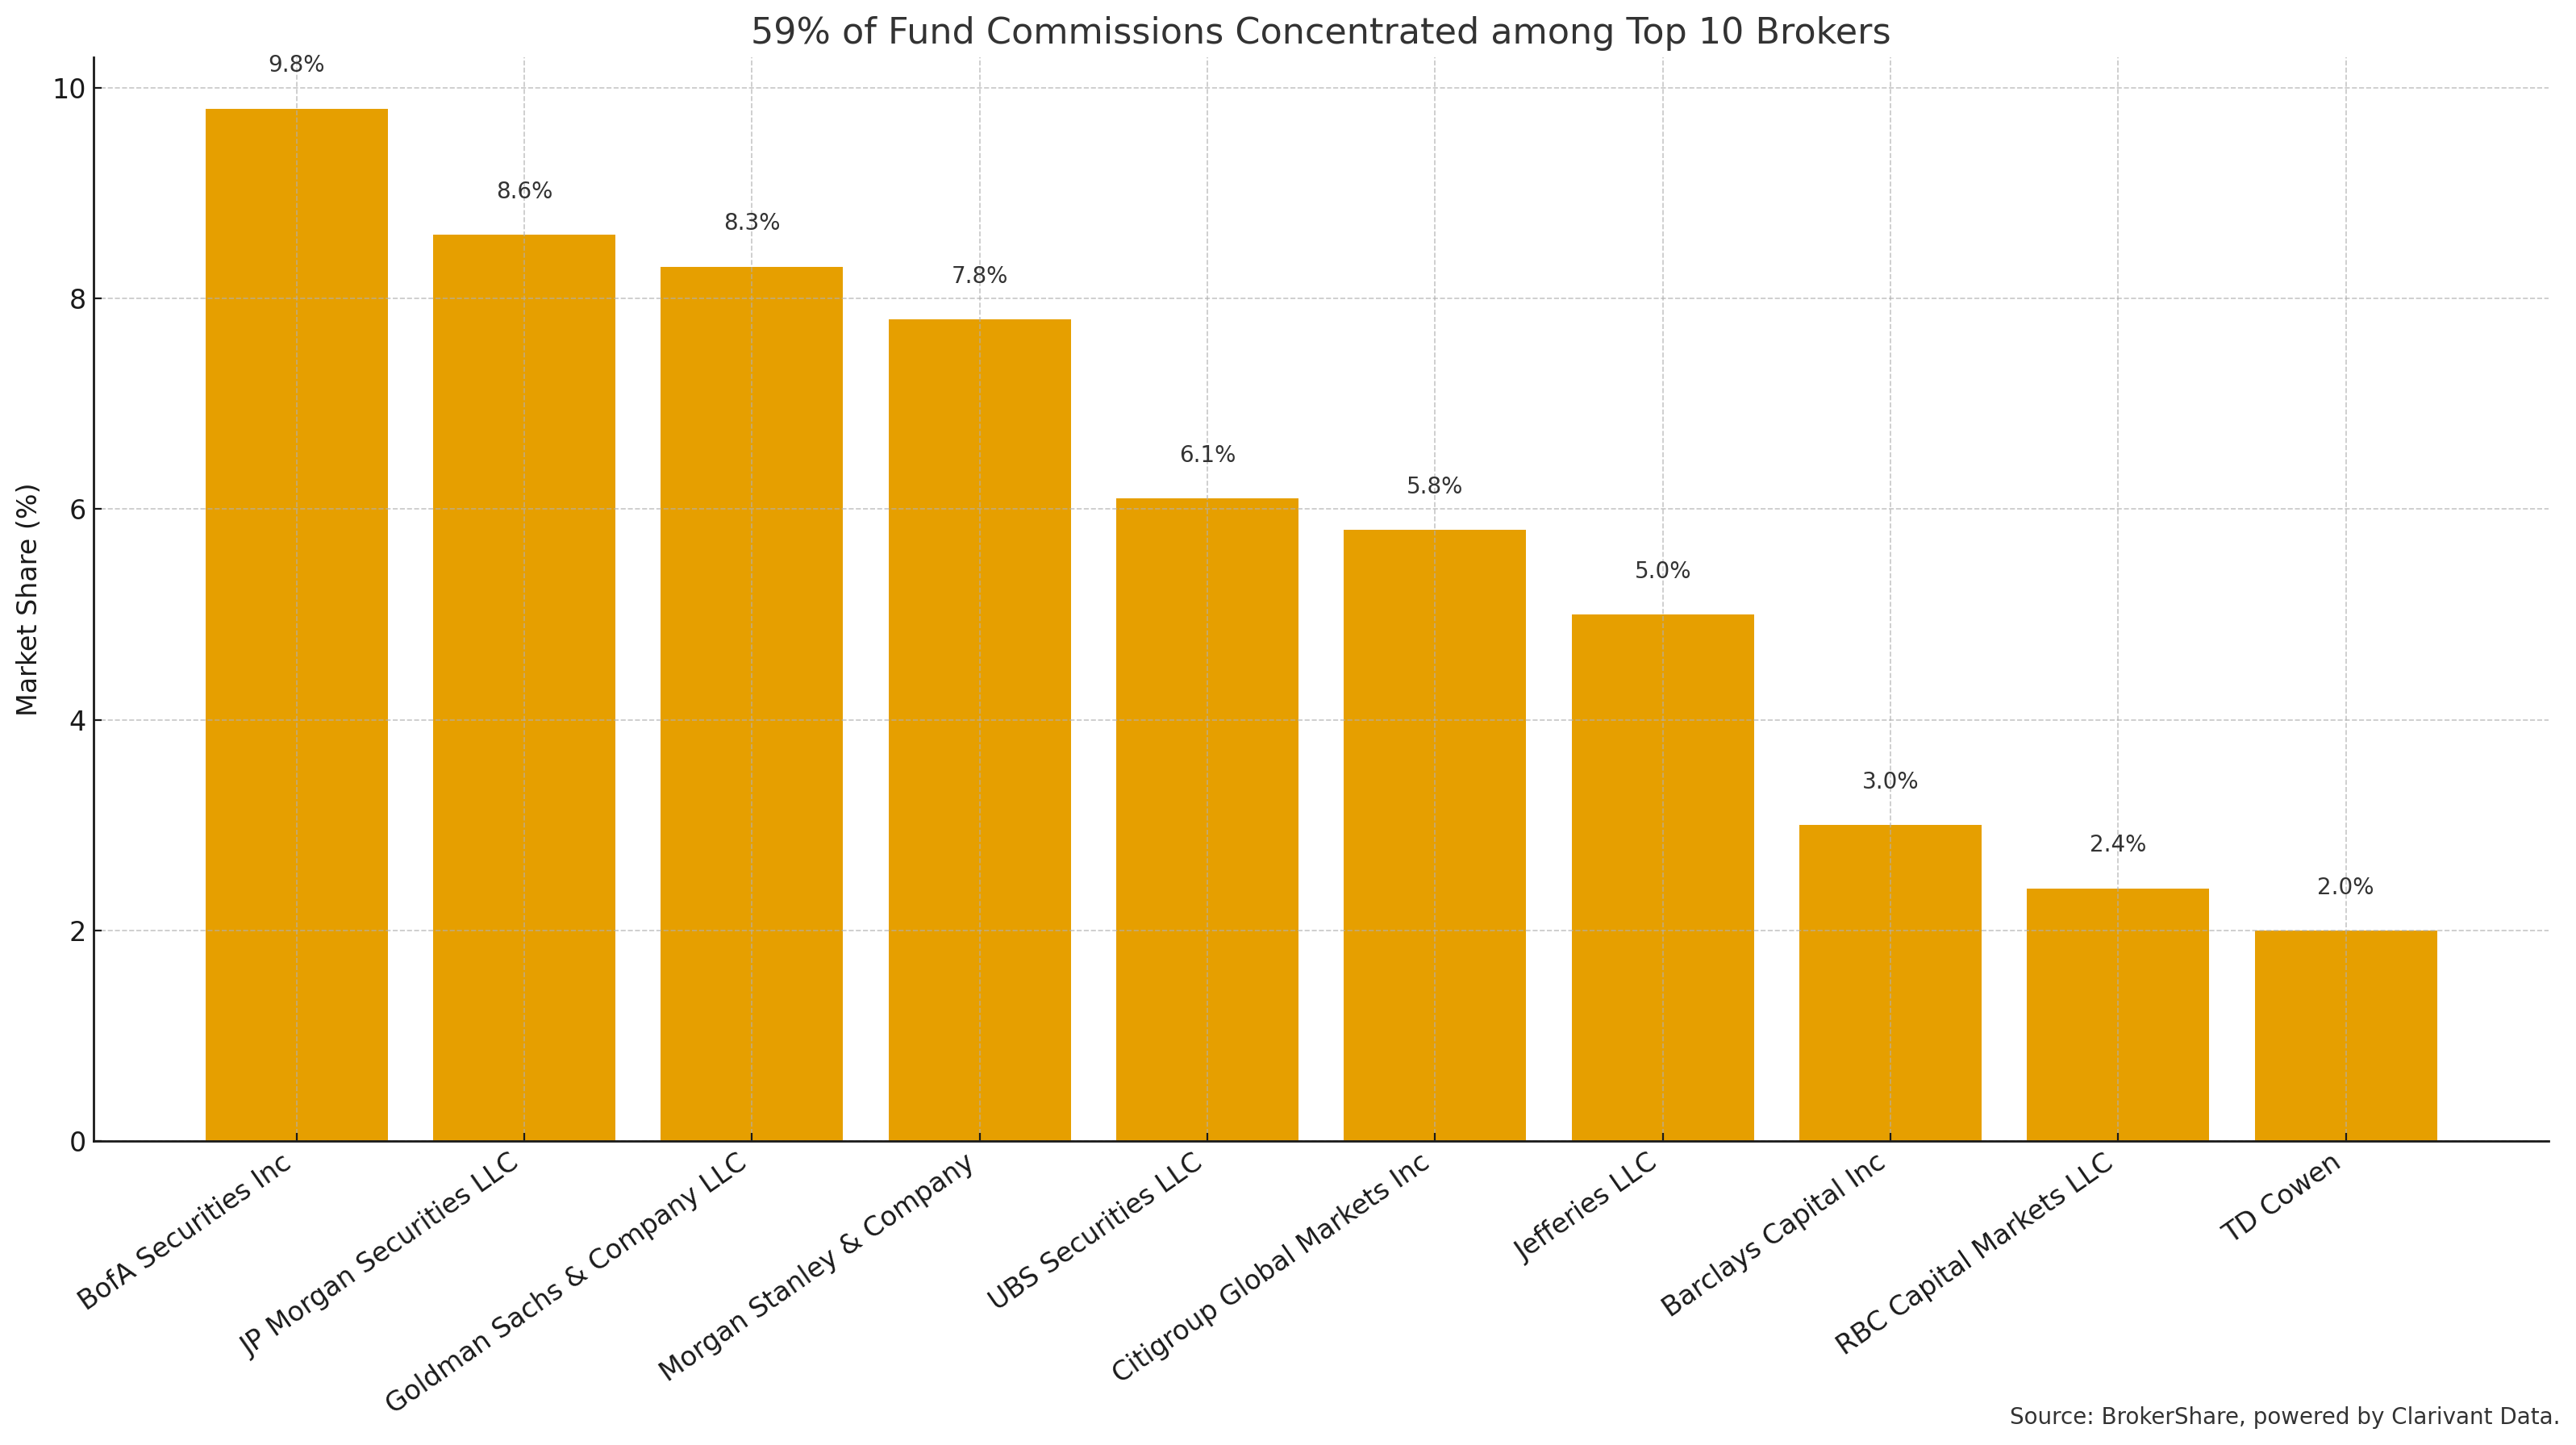
Top 5 brokers captured 41% of all agency commissions (BofA, JP Morgan, Goldman, Morgan Stanley, UBS).
Top 10 brokers accounted for 59%, leaving only $1.6B for more than 560 other firms.
Broker concentration remains high, but opportunities still exist in the long tail.
As derived from regulatory filings on registered investment companies, over the last 12 months investment managers overseeing mutual funds, ETFs, and other investment vehicles paid nearly $4 billion in agency commissions across all financial products.
This represents a 13.7% YoY increase, or an additional $471 million compared to the previous year.
BrokerShare’s analysis shows that while 59% of these commissions were captured by the Top 10 brokers, the remaining $1.6B was distributed across more than 560 brokers, underscoring both the dominance of the largest players and the fierce competition among mid- and smaller-tier firms.
Charts
Annual Fund Agency Commissions (5-Year Trend)Market Share Concentration: Top 10 Brokers (Trailing 12 Months)
For a deeper breakdown of market share—by broker, fund, account, or investment theme—and to benchmark your position against peers, explore
BrokerShare.